Project report — energy, IIoT, e-mobility
EcoPulse — platform for energy monitoring and load control
Five separated processing stages from Modbus connectivity at the installation to the Angular dashboard — architecture, development, quality assurance and operations with us.
- Industry
- Energy, IIoT, e-mobility
- System type
- Distributed platform, edge to web
- AereA's role
- Architecture, development, QA, operations
- Deployment
- On premises, cloud or hybrid
Starting point
Heterogeneous energy and charging infrastructure without a shared data base: every manufacturer with its own interface, no reliable basis for load decisions.
Approach
Five cleanly separated processing stages — edge connectivity, ingest via MQTT and Kafka, state projection into TimescaleDB, versioned REST API with live stream, Angular interface.
Result
Price- and CO₂-optimised charging and storage based on day-ahead prices from European bidding zones, with automated load shifting and storage control.
Results at a glance
- 20 connected device and manufacturer types via Modbus, SunSpec and vendor-specific interfaces
- Over 90 % test coverage across all microservices, as a mandatory CI gate
- Load shifting and storage control as automated interventions instead of manual regulation
- In operation for 2 years and still being extended
- Day-ahead prices from European bidding zones and grid CO₂ intensity as inputs to the optimisation
- Natural-language access to plant state and analyses via an STT → LLM → TTS pipeline
- Metrics, logs and traces end to end via Grafana, Prometheus, Loki and OpenTelemetry
Starting point
Energy and charging infrastructure rarely grows to a plan. It grows in steps: first the photovoltaics, then the storage, later the wallboxes, at some point a second meter for the new part of the building. Every device brings its own interface, every manufacturer its own data model.
The result is an operation with plenty of numbers and still no basis for decisions: the inverter knows its generation, the wallbox knows its charge state, the meter knows the grid draw — but nobody knows the whole picture at the same point in time.
The task
What was needed was not a visualisation but a basis for decisions. The platform had to:
- connect devices from different manufacturers without every new device class touching the analysis,
- consolidate telemetry into a shared, high-resolution time series base,
- automatically derive charging, discharging and load-shifting decisions from it,
- and do both: run on premises or in the cloud.
Architectural decisions
The platform is built as an event-driven microservice landscape in five cleanly separated processing stages. That separation is the core of the design: it allows one stage to change without touching the others.
- Device connectivity / edge — inverters and meters via Modbus and SunSpec, charging infrastructure and third-party systems via vendor-specific interfaces. Pre-processing and normalisation happen close to the device, so only reliable values move on.
- Ingest & streaming — telemetry ingestion via MQTT, downstream processing via Kafka or Redpanda. Acquisition, processing and analysis are decoupled: an outage in the analysis costs no measurements.
- State projection — deriving the current plant state from the event stream, persisting historical data in PostgreSQL with TimescaleDB, caching hot values in Redis.
- REST API & live stream — versioned REST/OpenAPI interface for queries and configuration, SignalR for push updates to the interface.
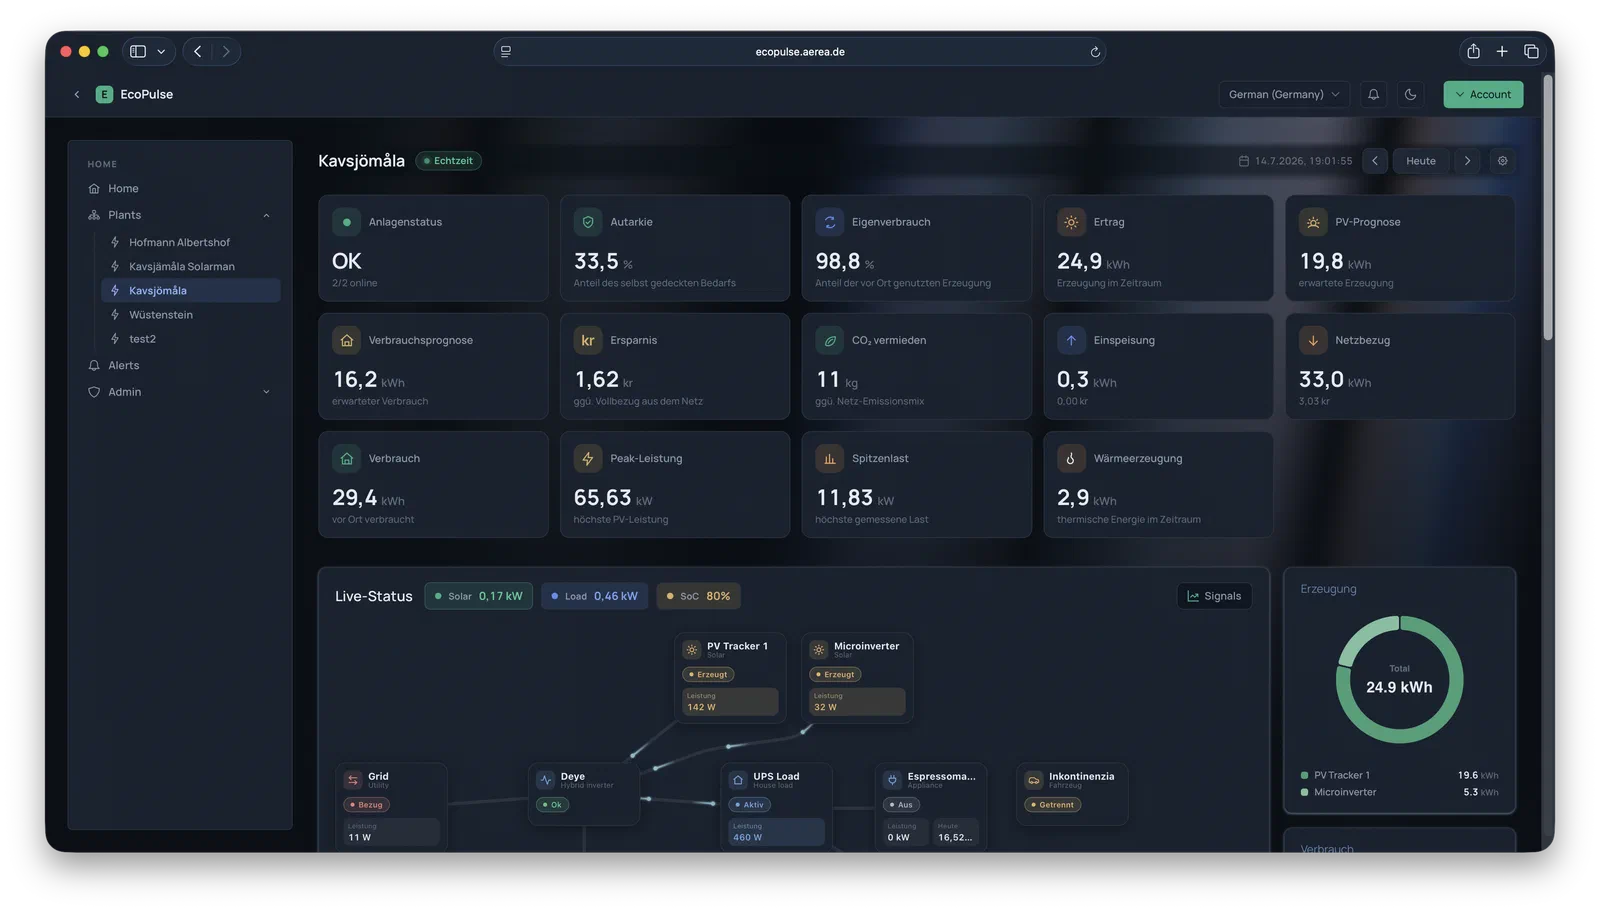
- Web interface — Angular frontend with real-time dashboards, historical analyses and control functions.
Why event-driven
An energy system is a stream of events, not a state you query. Event-driven processing has three practical consequences: historical trajectories are fully reconstructable, new analyses can be retrofitted onto existing data, and load decisions remain traceable after the fact — which is not an academic property when a system intervenes in a physical installation automatically.
Implementation
Market data integration
Day-ahead electricity prices from European bidding zones and grid CO₂ intensity data feed into the optimisation as inputs. The installation therefore decides not only by self-consumption but by price and emission intensity.
Forecasting and optimisation
Predictive models for electricity price, generation and consumption form the basis for storage charging and discharging strategies and for time-shifting flexible loads. Training and evaluation run on the platform’s own high-resolution time series — with Python, Pandas, NumPy and scikit-learn against TimescaleDB.
Load management
Peak shaving, self-consumption optimisation and dynamic balancing between grid supply, storage and generation. For e-mobility, charging infrastructure and vehicle-side data sources are added — state of charge and location allow time- and price-optimised charging.
AI assistance
Plant state and analyses are additionally accessible in natural language, via an STT → LLM → TTS pipeline. The practical value lies less in the speech than in the query: someone asking “how did self-consumption last week compare to last year?” does not need to know how to operate a dashboard.
Quality assurance
The test architecture is the part of this project we point to most often when someone wants to know how we work.
- Automated tests across all microservices — from device connectivity through streaming processing to the web interface.
- End-to-end tests against a genuinely running API, including a real database via Testcontainers and covering authorisation and error paths. Not against mocks: a mock confirms your own assumption, a real database contradicts it.
- Frontend tests of the Angular interface — component, service and behaviour tests as a mandatory CI gate.
- Test-driven development (red/green/refactor) as a binding team standard.
- Validation of streaming and real-time data and of time series-based analyses — the part standard test tooling does not cover.
- Reproducible test environments and synthetic test data via Docker and Testcontainers.
Operations
Metrics, logs and traces run end to end via Grafana, Prometheus, Loki and OpenTelemetry. For a platform that intervenes in an installation automatically, observability is not an operational extra but part of the safety argument: every decision has to be explainable afterwards.
Conclusion
EcoPulse shows the pattern we use for systems of this kind: separate processing stages cleanly, isolate device connectivity, derive decisions from an event stream rather than from snapshots — and set up the test architecture so that it finds the failures that actually occur in distributed systems.
Technologies
Frequently asked questions
Can EcoPulse be connected to existing installations?
Yes. Device connectivity sits in its own processing stage. Inverters and meters come in via Modbus and SunSpec, charging infrastructure and third-party systems via vendor-specific interfaces. A new device class only affects that stage, not the analysis.
Does the platform run in the cloud or on site?
Both. The stages are decoupled via MQTT and Kafka, so data acquisition can stay on site while analysis and interface run externally. For installations with data sovereignty requirements we operate the full stack on premises.
How do you test a platform with that many third-party devices?
On three levels: unit tests per service, integration tests against genuinely running databases via Testcontainers, and end-to-end tests against the live REST API including authorisation and error paths. For devices unavailable in test, we work with synthetic telemetry data sets.
Contact
Your contact
Software architecture & technical project management